Statistical power and underpowered statistics
We’ve seen that it’s possible to miss a real effect simply by not taking enough data. In most cases, this is a problem: we might miss a viable medicine or fail to notice an important side-effect. How do we know how much data to collect?
Statisticians provide the answer in the form of “statistical power.” The power of a study is the likelihood that it will distinguish an effect of a certain size from pure luck. A study might easily detect a huge benefit from a medication, but detecting a subtle difference is much less likely. Let’s try a simple example.
Suppose a gambler is convinced that an opponent has an unfair coin: rather than getting heads half the time and tails half the time, the proportion is different, and the opponent is using this to cheat at incredibly boring coin-flipping games. How to prove it?
You can’t just flip the coin a hundred times and count the heads. Even with a perfectly fair coin, you don’t always get fifty heads:
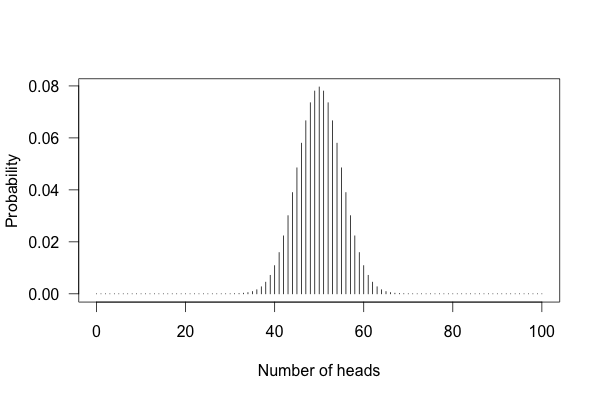
This shows the likelihood of getting different numbers of heads, if you flip a coin a hundred times.
You can see that 50 heads is the most likely option, but it’s also reasonably likely to get 45 or 57. So if you get 57 heads, the coin might be rigged, but you might just be lucky.
Let’s work out the math. Let’s say we look for a p value of 0.05 or less, as scientists typically do. That is, if I count up the number of heads after 10 or 100 trials and find a deviation from what I’d expect – half heads, half tails – I call the coin unfair if there’s only a 5% chance of getting a deviation that size or larger with a fair coin. Otherwise, I can conclude nothing: the coin may be fair, or it may be only a little unfair. I can’t tell.
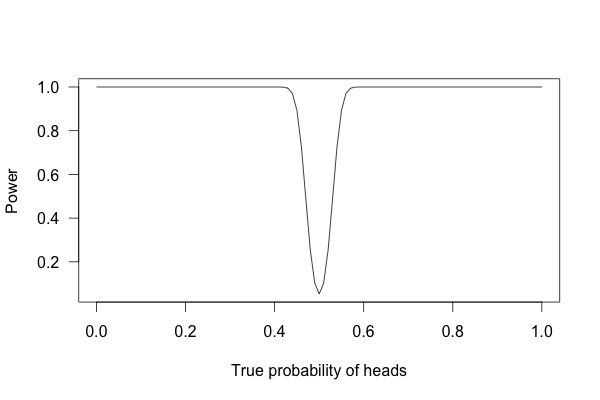
So, what happens if I flip a coin ten times and apply these criteria?
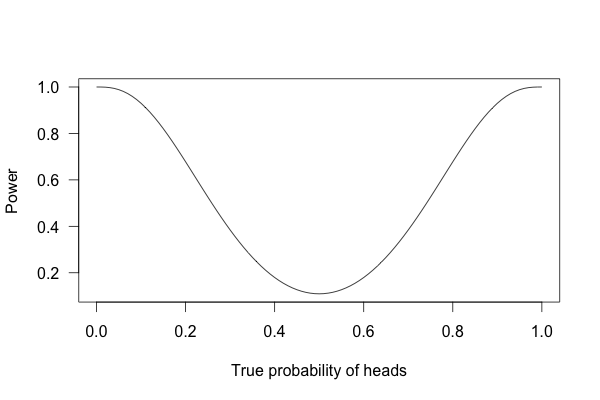
This is called a power curve. Along the horizontal axis, we have the different possibilities for the coin’s true probability of getting heads, corresponding to different levels of unfairness. On the vertical axis is the probability that I will conclude the coin is rigged after ten tosses, based on the p value of the result.
You can see that if the coin is rigged to give heads 60% of the time, and I flip the coin 10 times, I only have a 20% chance of concluding that it’s rigged. There’s just too little data to separate rigging from random variation. The coin would have to be incredibly biased for me to always notice.
But what if I flip the coin 100 times?
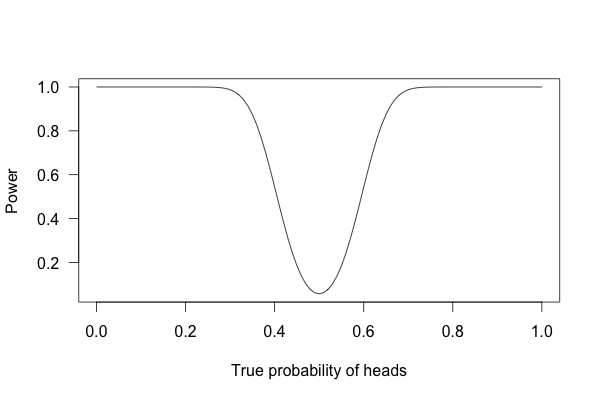
Or 1,000 times?
With one thousand flips, I can easily tell if the coin is rigged to give heads 60% of the time. It’s just overwhelmingly unlikely that I could flip a fair coin 1,000 times and get more than 600 heads.
The power of being underpowered
After hearing all this, you might think calculations of statistical power are essential to medical trials. A scientist might want to know how many patients are needed to test if a new medication improves survival by more than 10%, and a quick calculation of statistical power would provide the answer. Scientists are usually satisfied when the statistical power is 0.8 or higher, corresponding to an 80% chance of concluding there’s a real effect.
However, few scientists ever perform this calculation, and few journal articles ever mention the statistical power of their tests.
Consider a trial testing two different treatments for the same condition. You might want to know which medicine is safer, but unfortunately, side effects are rare. You can test each medicine on a hundred patients, but only a few in each group suffer serious side effects.
Obviously, you won’t have terribly much data to compare side effect rates. If four people have serious side effects in one group, and three in the other, you can’t tell if that’s the medication’s fault.
Unfortunately, many trials conclude with “There was no statistically significant difference in adverse effects between groups” without noting that there was insufficient data to detect any but the largest differences.57 And so doctors erroneously think the medications are equally safe, when one could well be much more dangerous than the other.
You might think this is only a problem when the medication only has a weak effect. But no: in one sample of studies published between 1975 and 1990 in prestigious medical journals, 27% of randomized controlled trials gave negative results, but 64% of these didn’t collect enough data to detect a 50% difference in primary outcome between treatment groups. Fifty percent! Even if one medication decreases symptoms by 50% more than the other medication, there’s insufficient data to conclude it’s more effective. And 84% of the negative trials didn’t have the power to detect a 25% difference.17, 4, 11, 16
In neuroscience the problem is even worse. Suppose we aggregate the data collected by numerous neuroscience papers investigating one particular effect and arrive at a strong estimate of the effect’s size. The median study has only a 20% chance of being able to detect that effect. Only after many studies were aggregated could the effect be discerned. Similar problems arise in neuroscience studies using animal models – which raises a significant ethical concern. If each individual study is underpowered, the true effect will only likely be discovered after many studies using many animals have been completed and analyzed, using far more animal subjects than if the study had been done properly the first time.12
That’s not to say scientists are lying when they state they detected no significant difference between groups. You’re just misleading yourself when you assume this means there is no real difference. There may be a difference, but the study was too small to notice it.
Let’s consider an example we see every day.
The wrong turn on red
In the 1970s, many parts of the United States began to allow drivers to turn right at a red light. For many years prior, road designers and civil engineers argued that allowing right turns on a red light would be a safety hazard, causing many additional crashes and pedestrian deaths. But the 1973 oil crisis and its fallout spurred politicians to consider allowing right turn on red to save fuel wasted by commuters waiting at red lights.
Several studies were conducted to consider the safety impact of the change. For example, a consultant for the Virginia Department of Highways and Transportation conducted a before-and-after study of twenty intersections which began to allow right turns on red. Before the change there were 308 accidents at the intersections; after, there were 337 in a similar length of time. However, this difference was not statistically significant, and so the consultant concluded there was no safety impact.
Several subsequent studies had similar findings: small increases in the number of crashes, but not enough data to conclude these increases were significant. As one report concluded,
There is no reason to suspect that pedestrian accidents involving RT operations (right turns) have increased after the adoption of [right turn on red]…
Based on this data, more cities and states began to allow right turns at red lights. The problem, of course, is that these studies were underpowered. More pedestrians were being run over and more cars were involved in collisions, but nobody collected enough data to show this conclusively until several years later, when studies arrived clearly showing the results: significant increases in collisions and pedestrian accidents (sometimes up to 100% increases).27, 48 The misinterpretation of underpowered studies cost lives.